Sanitary Engineering - Practical Class
WS 2016/2017
Sampling Lottery
Group number:
3
Date:
15.12.2016
Names of group members:
George Elias
Maryan Petreski
1. Aim of the experiment
The aim of the experiment is to see how the size and the number of the sample influences the precision
of the analysis.
2. Description of the experiment
For the aim of this experiment four groups were formed and each group had two different vessels (10, 20,
50, 100x2, 200, 500 and 1000 - measured in ml). According to the sample size needed, the weight of each
vessel was measured in a balance. Than the drum with pellets was tightly closed and turned 4~5 times in
order to mixed the different size and two coloured (black and white) pallets. The drum was opened and
every group collected their sample in the vessel and measured again the weight in the balance, in order to
determine the total number of pellets considering 1000g contains 55622 pellets. Each of the samples were
detailed analyzed in order to count the black pellets. After this procedure the samples were insert back to
the drum. Each of the above mention samples was taken 10 times, only the sample size of 10 ml was taken
20 times.
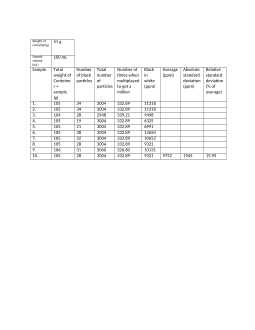
3. Evaluation of data
The experimental results are presented in appendix.
The samples for every volume were taken randomly, so sometime the mass is the same and sometime we
had slightly different mass. In the case of the smallest volume of 10 ml, the samples were taken 20 times
and 10 times for the rest in order to get representative samples. It is observed that the bigger the sample,
the higher the variation of black pellets among the sample. Absolute standard deviation is decreasing with
the increase of sampling volume. The absolute deviation was calculated first, and then we calculated the
relative deviation which is proportional to absolute: relative=absolute/average . it is concluded that with
the increase of the sample volume, its inhomogeneity increases, in other words the sample with the
volume of 10 ml shows the highest homogeneity.
4. Results and discussion
In order to make representative sampling, a huge number of samples are needed or extremely big samples
compared with the size of the population (as an example: Cr-content of the bike). Only then the
composition of waste can be defined. If it is not possible to make continuous measurements, it is better to
do bigger sampling testing only on what is a matter of interest. Finally, it is important to take into account
by whom, how often and where the samples are taken, which is also necessary in the sampling of waste, in
order to be certified by all regulations. As shown in the graph below, standard deviation is decreasing with
the increase of sampling volume which means that representativeness of the sample increases when
larger volume of the sample is used.